AI-CAIO SaaS
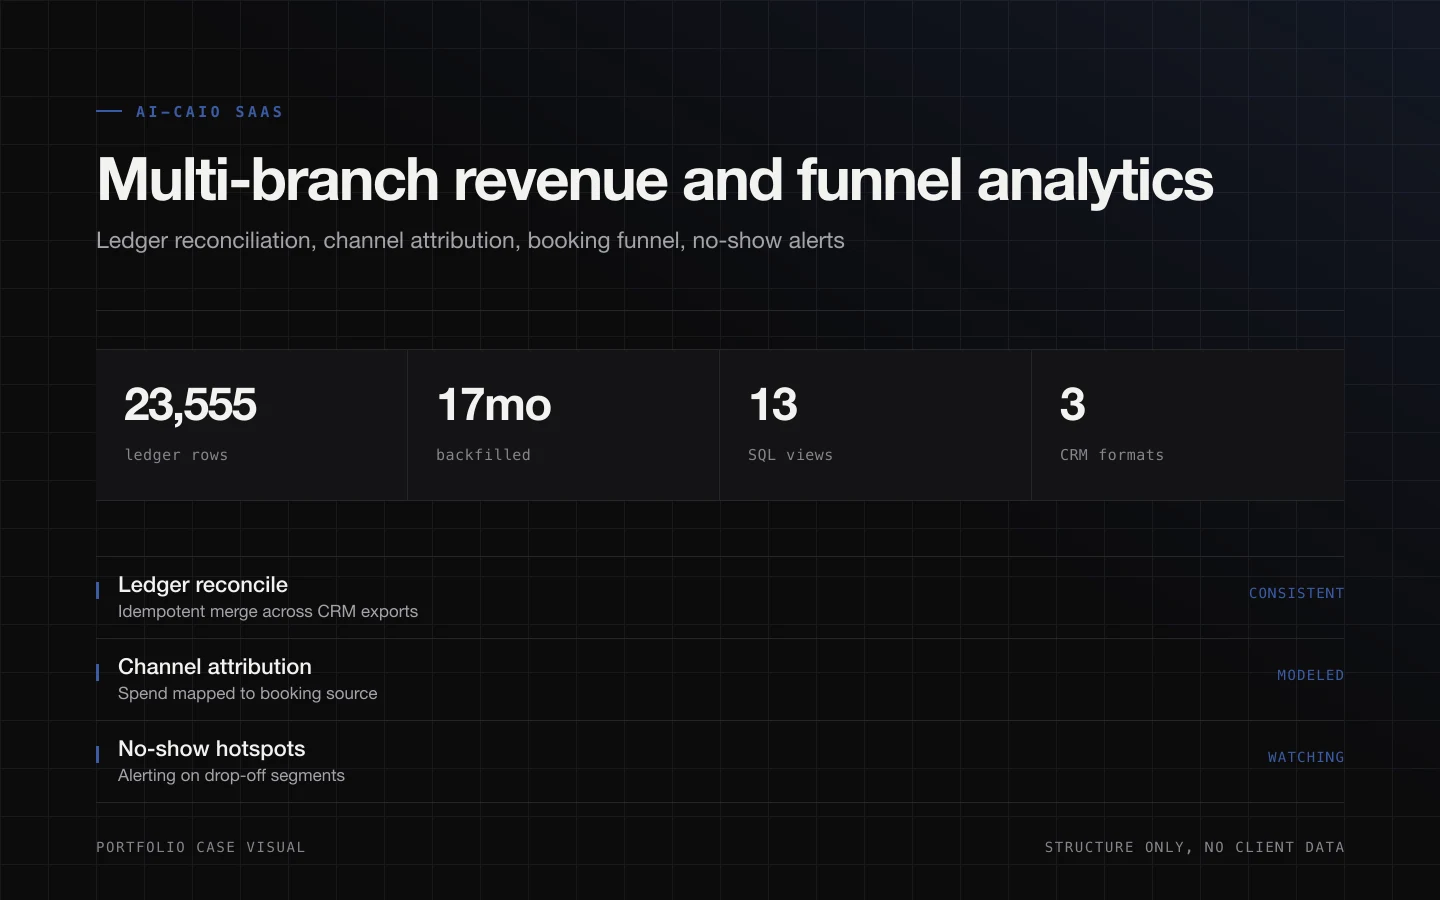
A multi-branch analytics platform reconciling 17 months and 23,555 revenue rows into channel attribution, booking funnels, and no-show risk views.
Overview
This one started because the branches ran different CRM formats and the revenue never matched. I reconciled 23,555 rows across 17 months so the same run always returns the same number, then built the analytics on top of that.
SQL views cut the data by branch, channel, treatment, and booking stage, with a React dashboard over them. Google Apps Script, Puppeteer, and Supabase handle the repeated collection and the weekly report on their own.
I spent almost no time making the charts pretty. No-show hotspots, channel attribution, and branch performance sit up front, because those are the ones an operator can act on the same day.
Core skills
Implementation
- 1Collected ledgers from Drive and Sheets, normalized duplicates and format drift, then built analysis units with Supabase SQL views.
- 2Built branch, channel, treatment, and booking-stage filters in React, with mobile card views for operators.
- 3Automated weekly WoW reporting and no-show hotspot alerts in an operator-friendly format.
Strengths
- Turns 23,555 revenue rows into reusable branch, channel, and treatment analysis models.
- Automates data collection, blog monitoring, sheet parsing, and 17-month backfill.
- Surfaces operationally actionable signals such as 20%+ no-show hotspots.
Metrics
Tech stack
Screenshots